Artefact
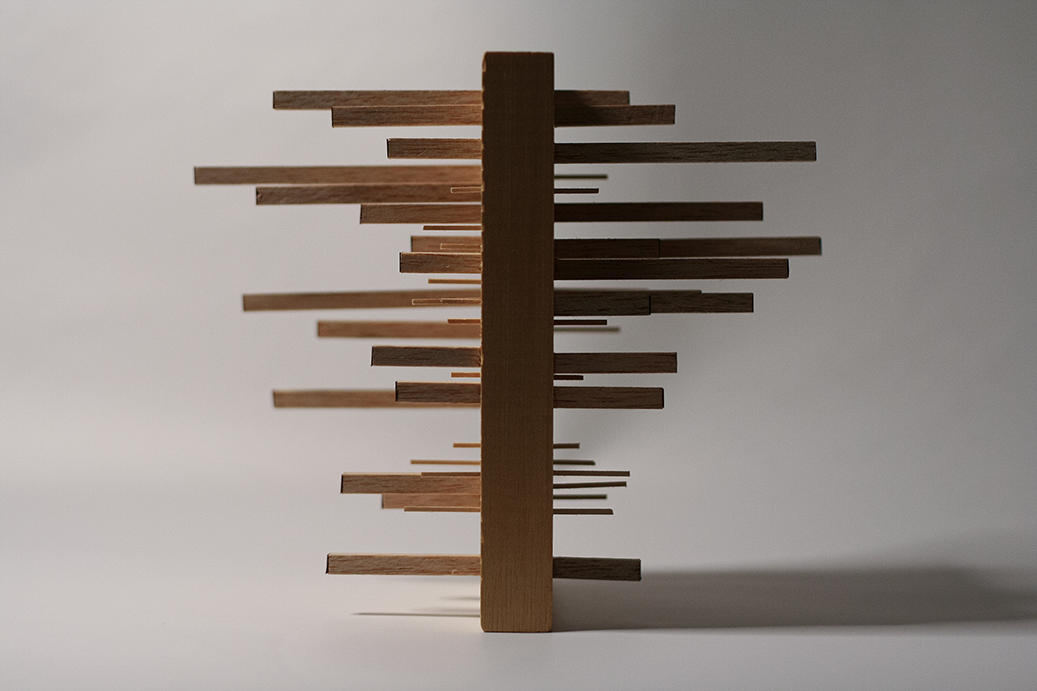
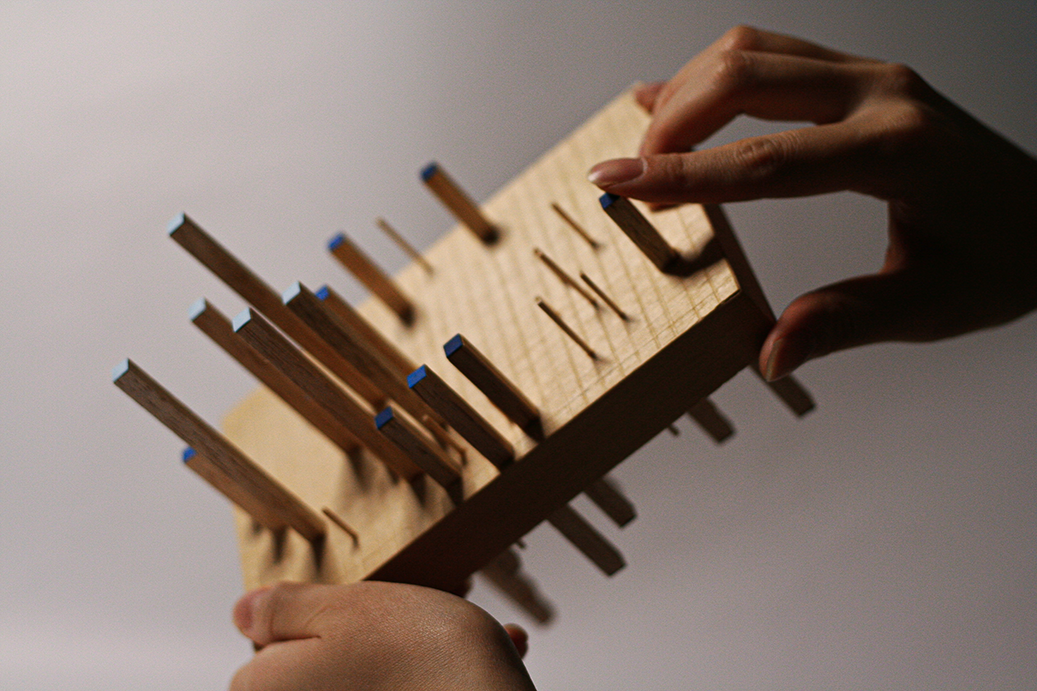
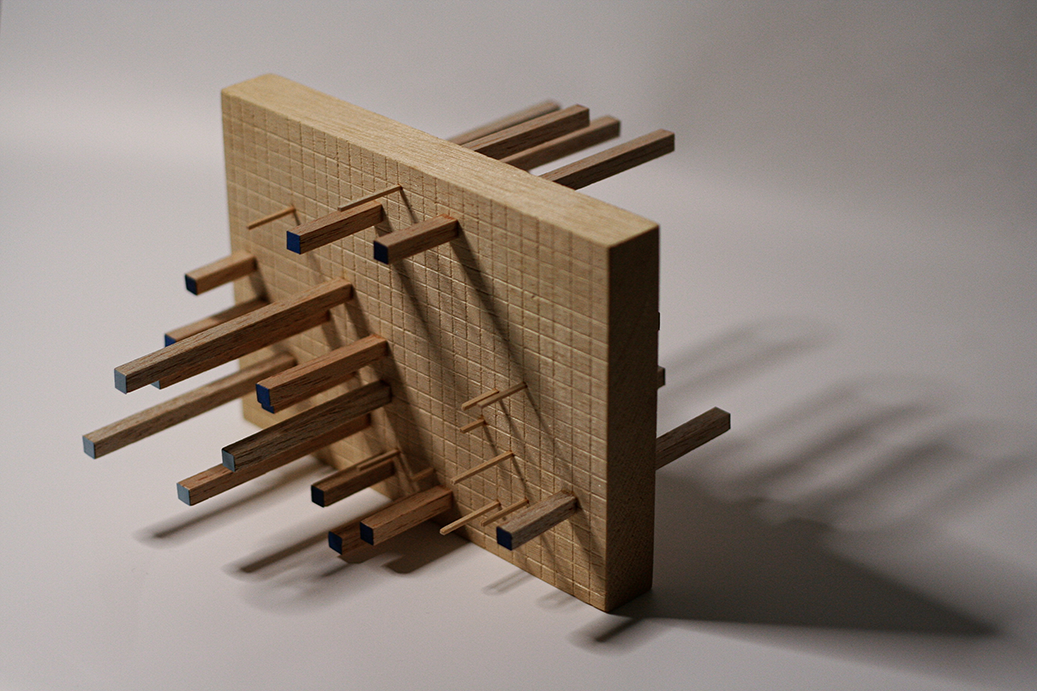
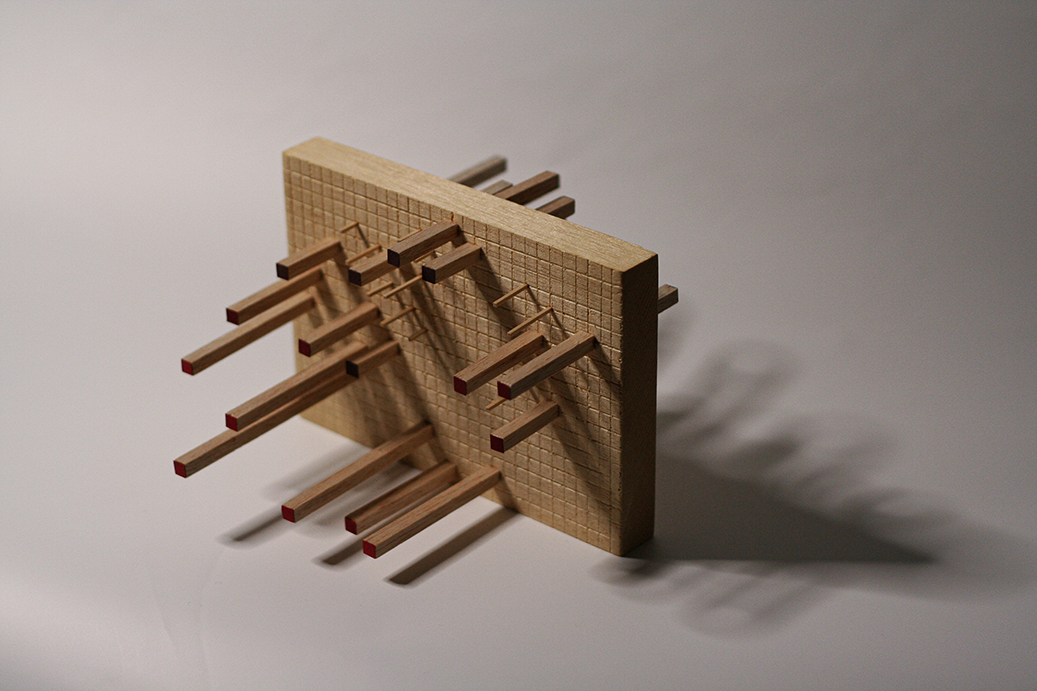
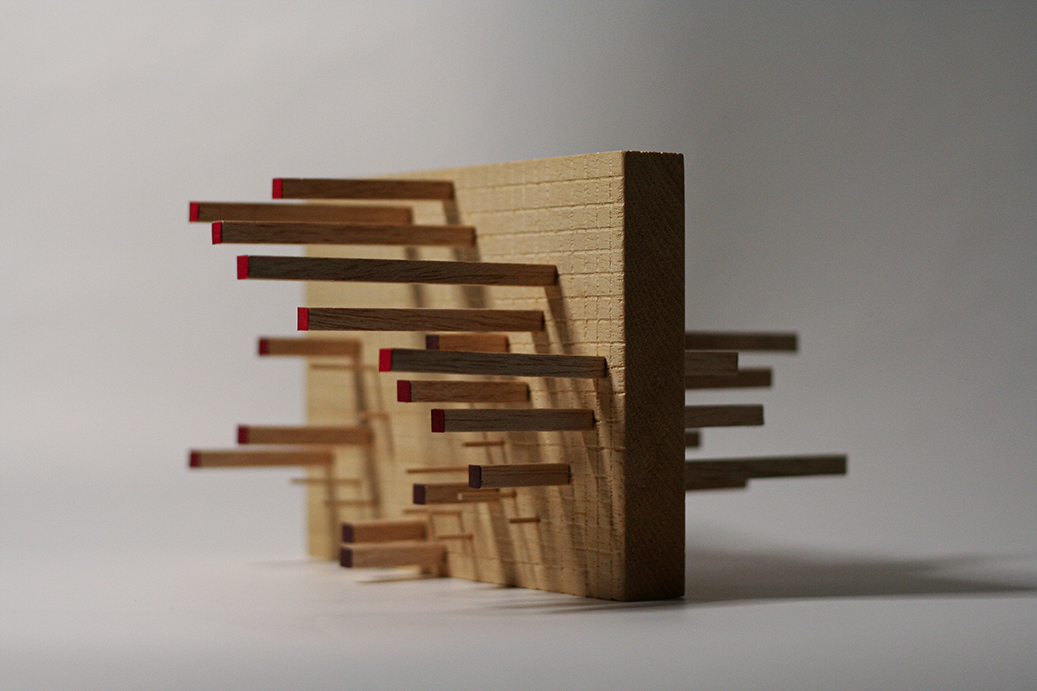
It is a data-based physical artifact made in three-dimensional to be effective in comparing bar graphs on a map.
Description
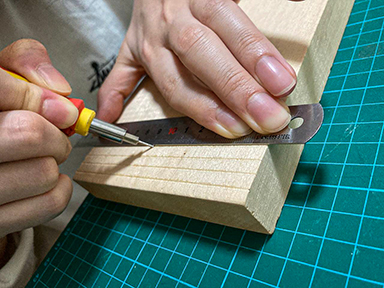
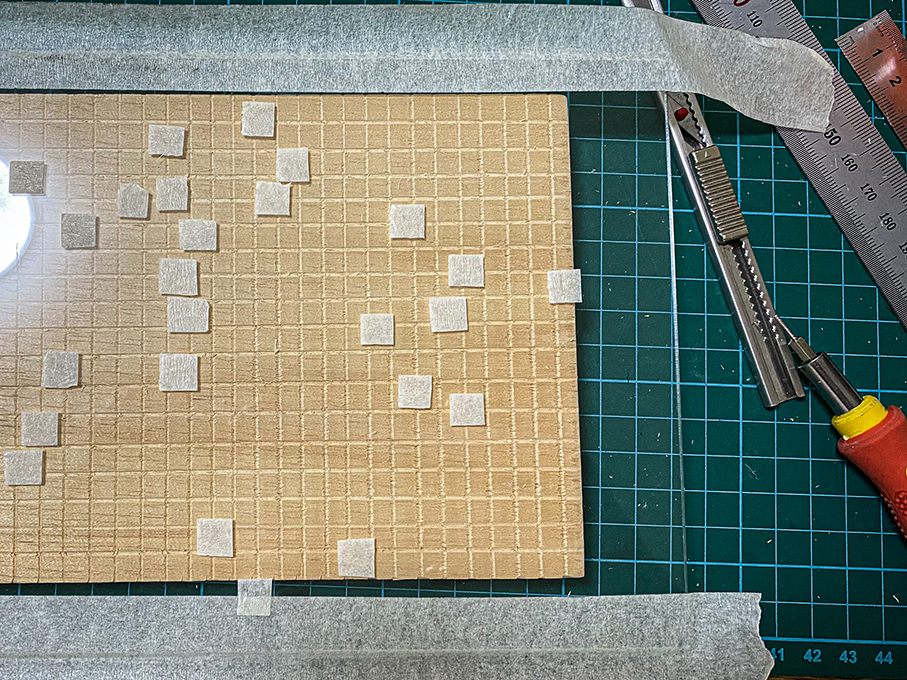
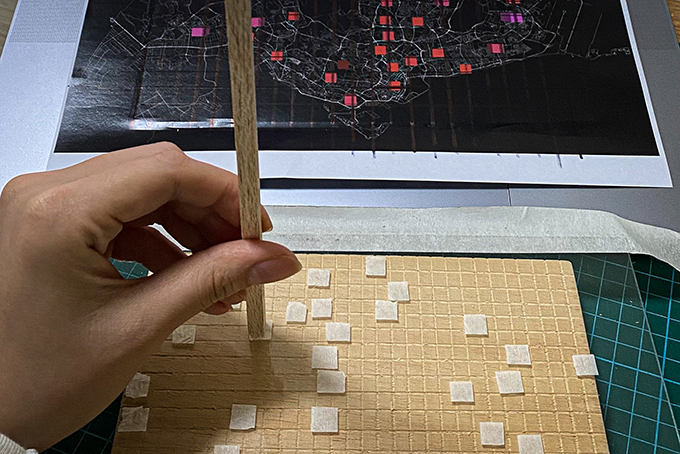
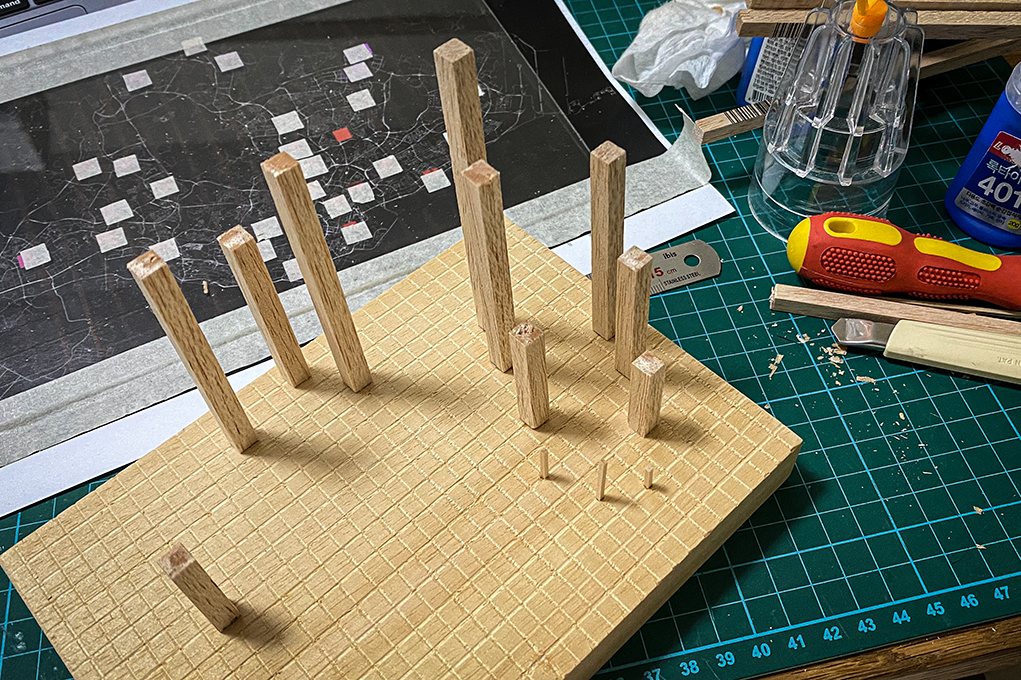
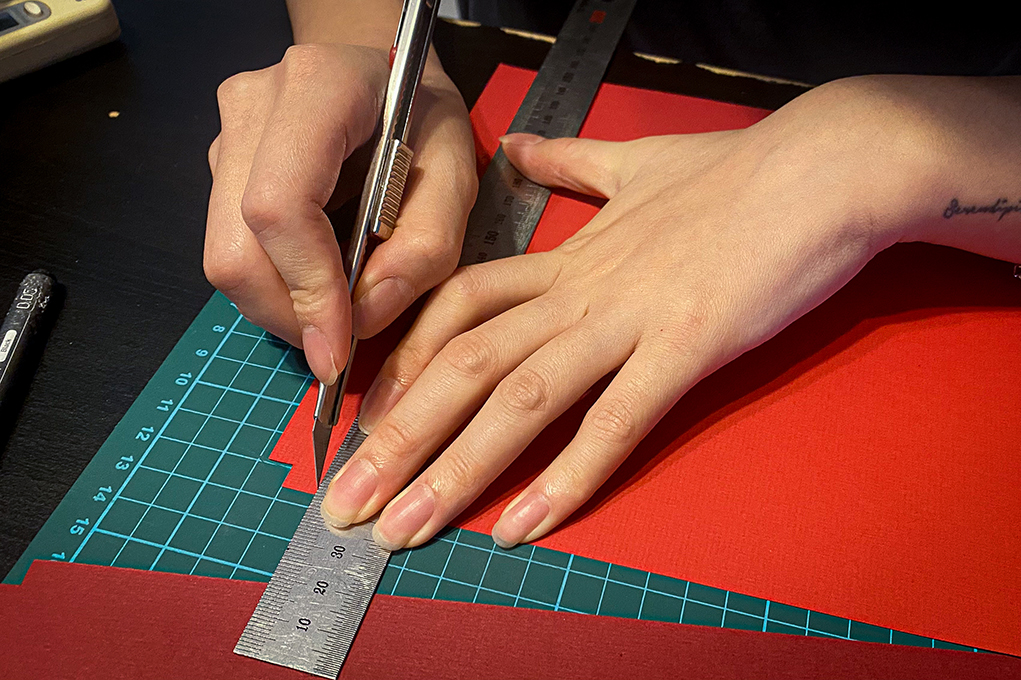
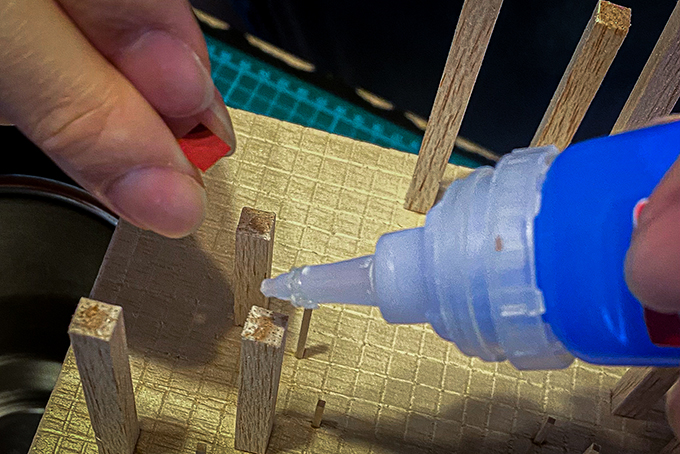
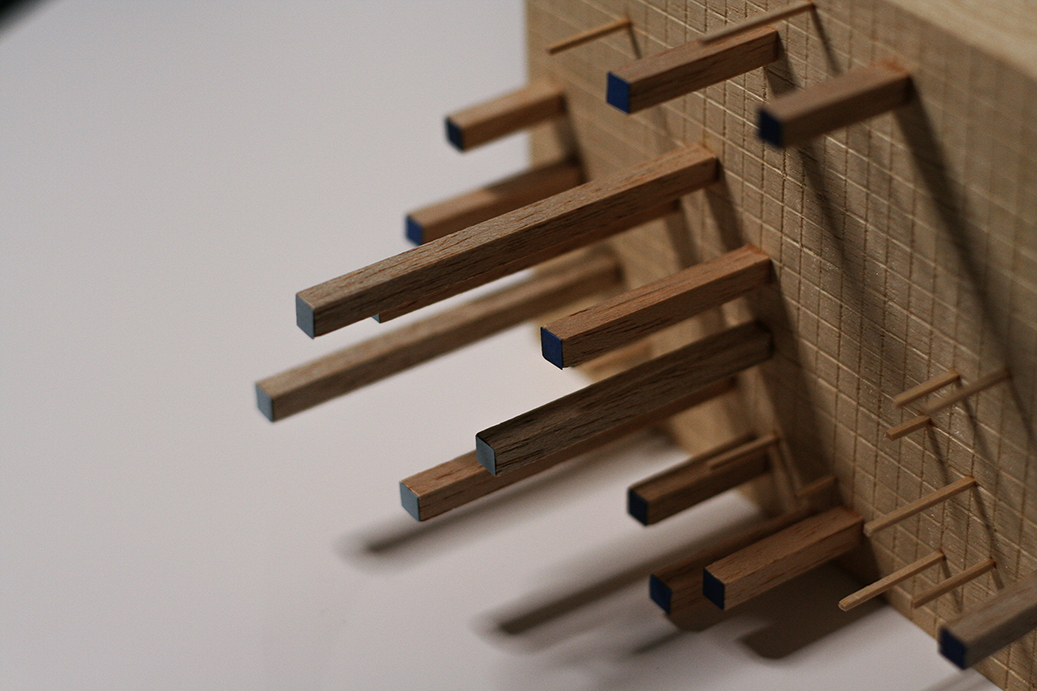
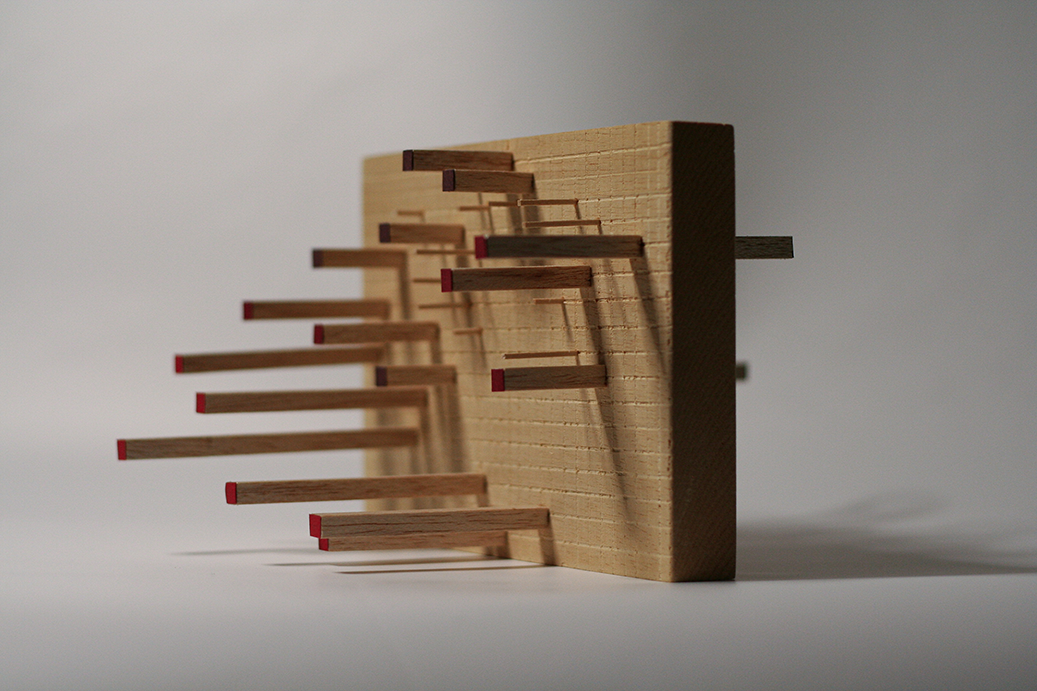
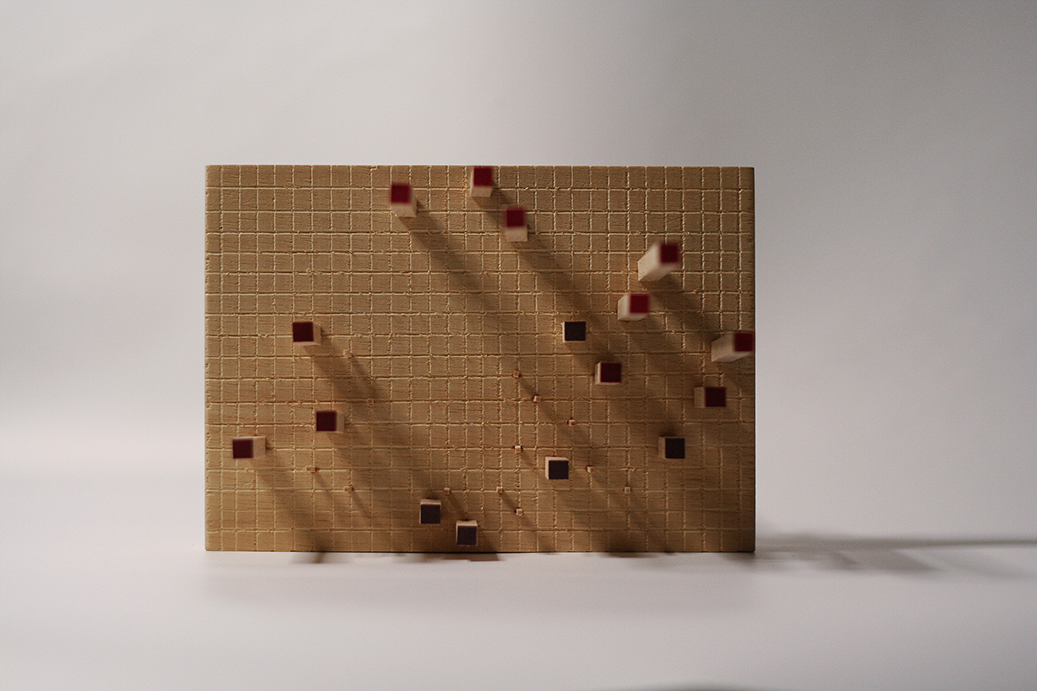
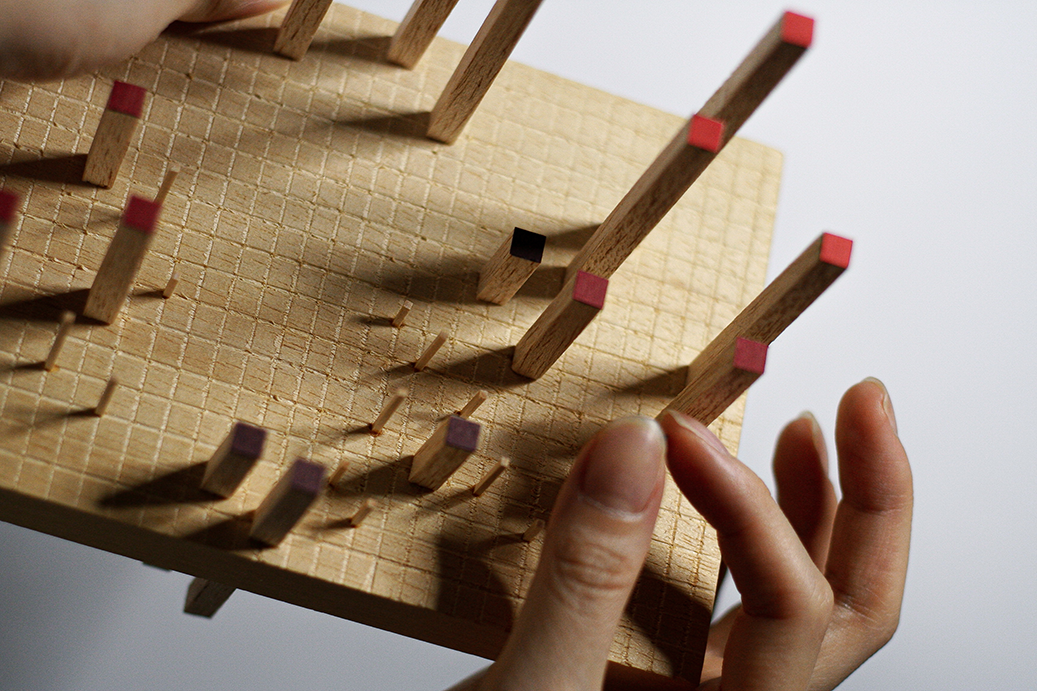
Created to show data more effectively, this data-based physical artifact is based on previous data visualization. The bar graph on the map had difficulty comparing the ratio of HDB residence by region between the elderly and children at a glance. To reinforce this, the two data were symmetrically constructed to make it easy to see. Overall, the artifact has long bars on both sides based on one wooden block. First, the wooden block consists of a square grid made by scratching a tree, which has two meanings. First, it symbolizes the appearance of Singapore HDB. Second, it serves as a layout for dividing multiple regions. The bar above it consists of two thicknesses. It is thick when the ratio is relatively high and thin when it is low. Using these factors, one side of the wooden block represents the distribution of the elderly and the other side represents the distribution of young children. Therefore, it is easy to see that although each of these artifacts is in the same area when viewed from the side, different distributions appear depending on age. Furthermore, when viewed from Top View, to show this more clearly, different colored paper was attached to the top of the graph bars of the elderly and young children. The higher the number, the brighter the color, and the lower the color, the darker the color.
